Class midpoints are an important concept in data analysis and statistics, and understanding them is essential for proper interpretation of data. A class midpoint is a value halfway between the lower boundary and the upper boundary of a class in a frequency distribution table.
For example, if you have a frequency distribution table that lists different classes with their frequencies, you can find the midpoint of each class by dividing the sum of the lower boundary and upper boundary of that class by two. For example, if there is a class with boundaries 10 and 19, then its midpoint would be calculated as (10 + 19) / 2 = 14.5.
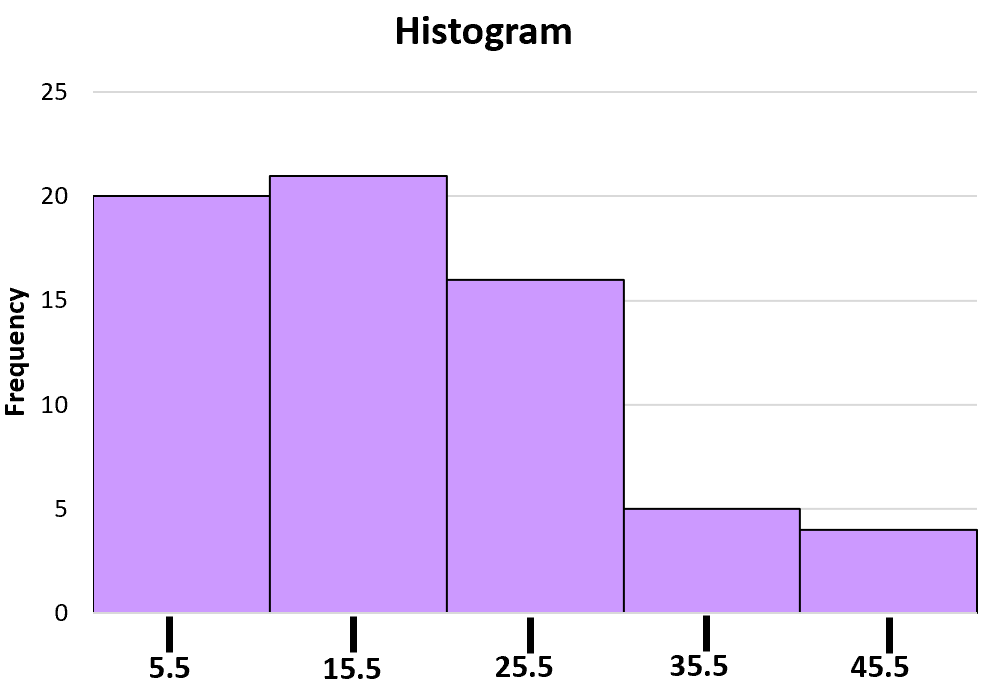
Class midpoints are often used when creating histograms to visualize the values in a frequency table. A histogram lists the classes along the x-axis of a graph and uses bars to represent the frequency of each class along the y-axis. Each bar is centered at its class midpoint so that it accurately reflects the data points wthin that class.
In addition to being used for visualizing data in charts, such as histograms, class midpoints are also used for other purposes such as calculating weighted averages or finding correlations between different variables. This makes them an important tool for statistical analysis and data interpretation.
In conclusion, understanding how to calculate and use class midpoints is essential for any student or practitioner dealing with statistics or data analysis. It provides an easy way to visualize data points within different classes, calculate weighted averages, and identify correlations between variables—all important steps in making sense of large sets of data.
Finding the Midpoint in a Frequency Table
The midpoint in a frequency table is the value that lies halfway between the lower and upper class limits of each class. To find the midpoint, simply add the lower limit and upper limit of the class together and divide by two. For example, if a frequency table has classes 0-5, 6-10 and 11-15, then the midpoint for each of these classes would be 2.5 (0+5/2), 8 (6+10/2) and 13 (11+15/2) respectively.

Finding the Midpoint of the 25 to 30 Class
The midpoint of the 25 up to 30 class is 27.5. This is calculated by adding the lower boundary (25) and the upper boundary (30) together, then dividing that sum by two.
Finding the Midpoint Between 10 and 19
The midpoint of 10 and 19 depends on the context. If we’re talking about a range of values between 10 and 19, inclusive, then the midpoint would be 14.5. However, if we’re talking about a range that includes values up to just below 20 (i.e. 10-
Using Class Midpoints
Class midpoints are used to provide a numerical representation of the center of each class in a frequency table. They allow us to easily visualize the data by plotting it on a graph, such as a histogram. The midpoint is calculated by adding the upper and lower class boundaries and dividing the result by two. This provides an indicative value for each class, which can then be plotted along the x-axis. The corresponding frequency of that class can then be plotted along the y-axis. This allows us to quickly identify patterns within our data set and draw conclusions abot it.
Finding the Midpoint of a Class Interval
The midpoint of a class interval is the average of the two endpoints of that interval. To find the midpoint, simply add the two limits of the interval together and divide by 2. For example, if we have a class interval with lower limit 3 and upper limit 7, we would calculate the midpoint by adding 3 and 7 together, then dividing by 2. This would give us (3 + 7) / 2 = 10 / 2 = 5, which is the midpoint of this class interval.

Calculating the Midpoint
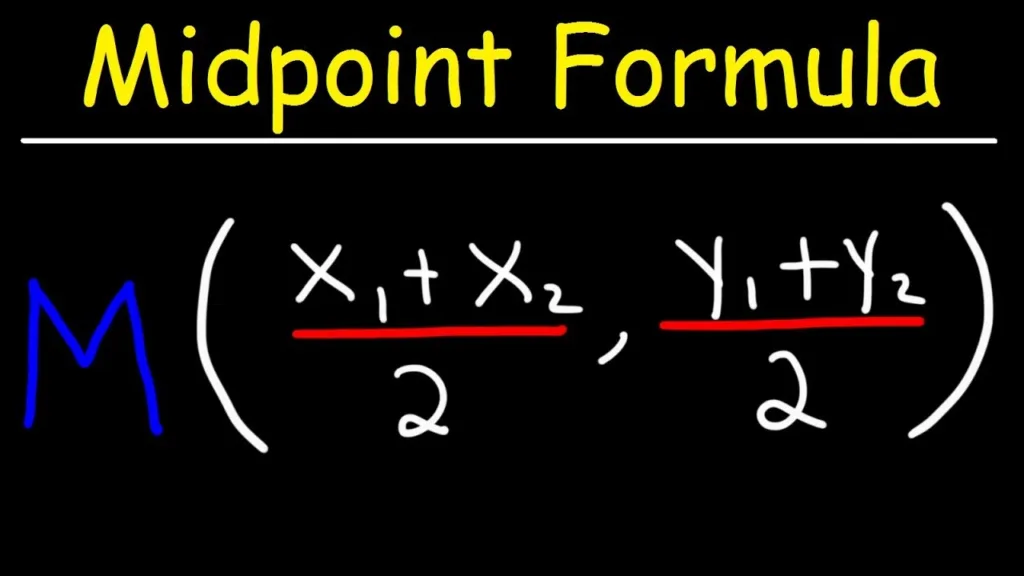
To calculate the midpoint of a line, you’ll need to first measure the distance between the two end points. Divide this distance by 2 to get the midpoint. Alternatively, you can add the two x coordinates of the endpoints and divide by 2, then do the same for the y coordinates. This will give you an (x,y) coordinate pair representing the midpoint of the line.
Finding the Midpoint Between 6 and 4
The midpoint of 6 and 4 is (5, -2). To find the midpoint, take the average of both x-coordinates (6+4=10/2=5) and the average of both y-coordinates (-4+0=-4/2=-2). The midpoint is (5,-2).
Finding the Midpoint Between 9 and 3
The midpoint of 9 and 3 is 6. This is because the midpoint of any two numbers can be calculated by taking the arithmetic average of the two numbers. In this case, the arithmetic average of 9 and 3 is 6, making 6 the midpoint between the two numbers.
Importance of Midpoint Method
The midpoint method is important because it provides a consistent and reliable way to calculate price elasticity. The formula uses the same base in both cases of a price increase or decrease, making it easier to compare the elasticity between two price points. Furthermore, it is a simple and straightforward method that can be applied to different types of goods and services. This makes it useful for businesses when making decisions about pricing strategies. Finally, the midpoint method is also used in economic theory and analysis, providing insight into consumer behavior for economists.

Source: toptal.com
The Importance of the Midpoint in Statistics
The midpoint of a confidence interval is an important statistic because it helps us to make an educated guess as to what the mean or proportion of a given population most likely is. The midpoint is calculated by taking the average of the lower and upper bounds of the confidence interval, and it gives us a more precise estimate than just lookig at the bounds alone. This can be especially useful when making decisions based on data, such as in business or public policy. Furthermore, when analyzing data such as survey results, the midpoint can provide valuable insight into how people feel about certain topics or issues. By utilizing this statistic, we can better understand how individuals are responding to certain questions and make more informed decisions based off that knowledge.
Calculating the Mean Using the Midpoint Method
Midpoint is used to calculate the mean because it provides an accurate representation of the central tendency of a set of data. By using the midpoint, we are able to take into account both the lower and upper boundaries of each class interval. This gives us a more accurate representation than simply taking an average of all the values in the data set. Additionally, by calculating the midpoint for each class interval, we can better understand how each value contributes to the overall mean.
Conclusion
In conclusion, class midpoints are a useful way to represent and visualize the values in a frequency table. The midpoint of each class is calculated by taking the sum of the lower class limit and the upper-class limit and dividing it by two. Class midpoints can then be used to create a histogram which plots the classes along the x-axis and uses bars to represent the frequency of each class along the y-axis, with each bar centered at its class midpoint.
