Correlation is a statistical measure used to determine the strength and direction of the relationship between two variables. It is a fundamental tool used in many fields, including finance, economics, and social sciences. However, one question that often arises is whether normalization affects correlation. In this blog post, we will explore this topic in detail and provide you with a comprehensive answer.
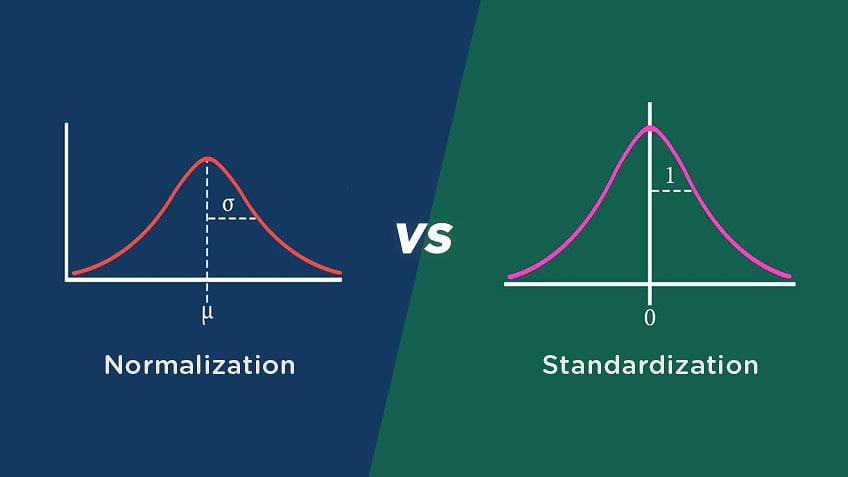
First, let’s understand what normalization is. Normalization is a technique used to rescale variables to a common range of values. The purpose of normalization is to bring all variables to a common scale so that the influence of one variable on the other can be more accurately determined. Normalization is a common preprocessing step in data analysis and machine learning.
Now, let’s turn our attention to correlation. Correlation is a measure of the strength and direction of the relationship between two variables. It ranges from -1 to +1, where -1 indicates a perfect negative correlation, +1 indicates a perfect positive correlation, and 0 indicates no correlation. The correlation coefficient is calculated by dividing the covariance of the two variables by the product of their standard deviations.
The question is, does normalization affect correlation? The answer is no. Normalization does not affect the correlation coefficient. This is because correlation is a measure of the relationship between two variables, and normalization only rescales the variables. The correlation coefficient is independent of the change of origin and scale of the variables. It is a standardized measure that gives us information about the strength and direction of the relationship between two variables.
To understand this better, let’s take an example. Suppose we have two variables, X and Y. The correlation coefficient between the two variables is calculated as follows:
R(X,Y) = Cov(X,Y) / (SD(X) * SD(Y))
If we normalize both variables by subtracting the minimum value and dividing by the range, the new normalized variables are X’ and Y’. The correlation coefficient between the normalized variables is calculated as follows:
R(X’,Y’) = Cov(X’,Y’) / (SD(X’) * SD(Y’))
However, we can see that both equations are equivalent. The covariance of the normalized variables is the same as the covariance of the original variables, and the product of the standard deviations of the normalized variables is the same as the product of the standard deviations of the original variables. Therefore, the correlation coefficient remains the same, regrdless of whether the variables are normalized or not.
Normalization does not affect the correlation coefficient. This is because the correlation coefficient is a standardized measure that is independent of the change of origin and scale of the variables. Therefore, when analyzing the relationship between two variables, it is not necessary to normalize them before calculating their correlation coefficient.
Do Correlations Require Normalization?
Normalization is not necessary for calculating correlation, as the correlation coefficient is a standardized measure that is not affected by chnges in scale or units of measurement. The correlation coefficient measures the strength and direction of the linear relationship between two variables, and it is a unitless value that ranges from -1 to 1. This means that the correlation coefficient remains the same regardless of how the variables are scaled or measured. However, normalization may be useful in some cases to compare variables that have different scales or units of measurement, as it can make it easier to interpret the correlation coefficient and identify patterns in the data. Normalization involves transforming the data so that it has a mean of zero and a standard deviation of one, which can help to remove the effects of different scales or units of measurement. while normalization is not necessary for calculating correlation, it can be a useful tool for interpreting and comparing data.

Impact of Standardization on Correlation
Standardization does not affect the correlation between variables. This is because standardization is a linear transformation of the variables that does not alter the relationship between them. When we standardize a variable, we subtract its mean from each observation and then divide by its standard deviation. This process changes the scale of the variable but does not change the relationship between the variables.
The correlation coefficient is a measure of the strength and direction of the linear relationship between two variables. It is calculated by dividing the covariance between the two variables by the product of their standard deviations. When we standardize the variables, their means become zero and their standard deviations become one. This means that any prior scaling effect that might affect the covariance will be nullified by the scale normalization that gies the final correlation estimate.
Therefore, standardization does not affect the correlation between variables, but it can make it easier to compare the strength of the relationship between variables that are measured on different scales. By standardizing the variables, we put them on a common scale, making it easier to compare their correlations.
Normalizing Correlation Values
Correlation values can be normalized by using a technique called Fisher’s transformation. This transformation converts the correlation values to a standard normal distribution, with a mean of zero and a standard deviation of one.
To perform Fisher’s transformation, first calculate the correlation coefficient between two variables. Then, take the natural logarithm of (1 + r) and (1 – r), where r is the correlation coefficient. Next, subtract these two values and divide by 2. The resulting value is the Fisher z-score.
Once you have calculated the Fisher z-score for each correlation coefficient, you can then apply any standard normalization technique, such as subtracting the mean and dividing by the standard deviation, to make the values fall within a range of 0 to 1.
This normalization process is commonly used in varius fields, including statistics, finance, and neuroscience, to compare correlations between different variables and to identify patterns and relationships between them.
Do Pearson Correlation Require Data Normalization?
When calculating the Pearson correlation coefficient, it is not necessary to normalize or standardize the data. The Pearson correlation coefficient is a measure of the linear relationship between two variables, and it is calculated as the covariance of the two variables divided by the product of their standard deviations.
Normalization or standardization involves transforming the data so that it has a mean of zero and a standard deviation of one. While this can be useful in some analyses, it is not necessary for calculating the Pearson correlation coefficient. The reason for this is that the Pearson correlation coefficient is independent of changes in the scale or origin of the data.
In oter words, whether the data is measured in inches or centimeters, or whether it is shifted by a constant value, the correlation coefficient will remain the same. This is because the correlation coefficient measures the degree to which two variables vary together, not the specific values of the variables.
Therefore, normalizing or standardizing the data will not alter the value of the Pearson correlation coefficient, and it is not necessary to do so for this type of analysis.
The Impact of Normalization on Correlation
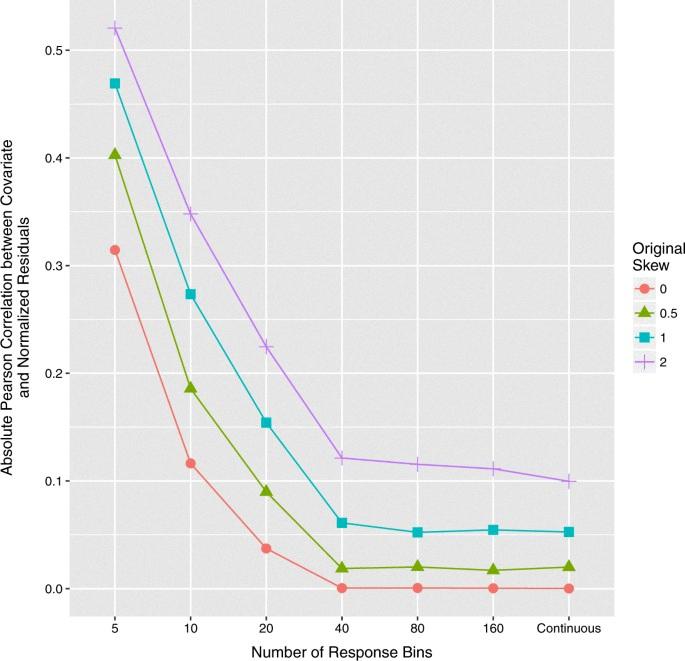
Correlation can change after normalization. Normalization methods are applied to gene expression data to remove systematic biases and to adjust for differences in the distribution of gene expression values across diffrent samples or experimental conditions. These differences can lead to spurious correlations between genes, which may obscure biologically meaningful associations.
Normalization methods aim to remove these biases and make the data more comparable across samples or conditions. By doing so, they can reduce the correlation between genes that is due to technical factors rather than biological interactions.
Furthermore, normalization can also affect the true correlation between genes, as it can reveal or strengthen associations that were previously masked by technical noise. In some cases, normalization can lead to an increase in correlation between genes that are biologically related, while in other cases it can decrease correlation between genes that are not related.
Therefore, normalization is a crucial step in analyzing gene expression data, as it can help to identify meaningful biological associations and reduce the impact of technical noise. However, it is important to choose an appropriate normalization method that is suitable for the specific dataset and research question, as different methods can have different effects on the correlation structure of the data.

Source: nature.com
Do Correlations Require Normal Distribution?
Normal distribution is needed for the Pearson r correlation. The Pearson r correlation assumes that both variables are normlly distributed, which means that the data should follow a bell-shaped curve. This is important because the Pearson r correlation measures the linear relationship between two variables, and assumes that the relationship is symmetrical and normally distributed. If the data is not normally distributed, the correlation coefficient may not accurately reflect the true relationship between the two variables. Additionally, other assumptions such as linearity and homoscedasticity should also be met for accurate interpretation of the Pearson r correlation. Therefore, it is important to check for normality and other assumptions before using the Pearson r correlation.
The Impact of Normalization on Linear Regression
Normalization does affect linear regression. In a linear regression model, the coefficients represent the importance of each feature in predicting the target variable. However, if the features have different scales, then the coefficients may not accurately reflect their true importance. This is because the model places more emphasis on features with larger scales, even if they are not actually more important.
Normalization is a technique used to scale all the features to a similar range, typically between 0 and 1 or -1 and 1. By doing so, the model can assign equal importance to each feature and avoid the issue of different scales. Additionally, normalization can help prevent the vanishing gradient problem during training, which is when the gradient becoes extremely small and slows down the learning process.
Therefore, it is recommended to normalize the features when training a linear regression model to ensure accurate coefficient values and efficient training.
The Impact of Data Scaling on Correlation
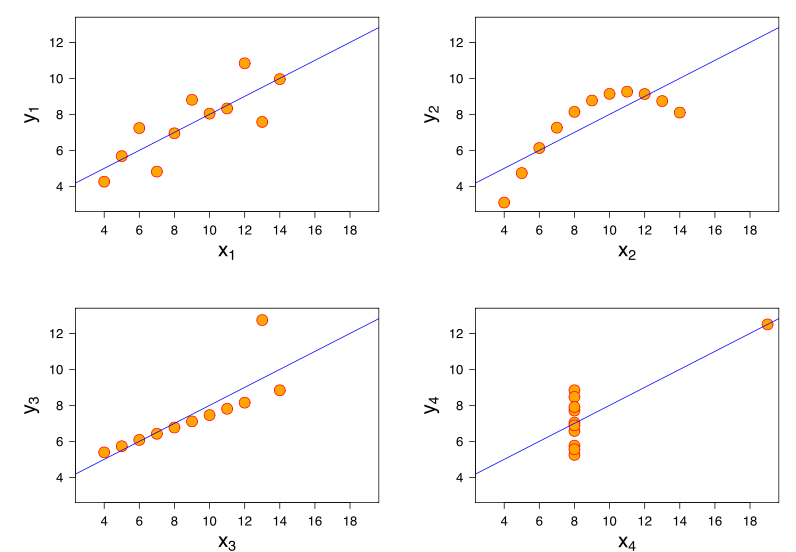
Correlation is not sensitive to the scale of data. This means that the correlation value remains the same irrespective of the units or scales used to measure the variables. For instance, if we have two variables, let’s say A and B, and we measure A in meters and B in centimeters, the correlation value betwen them will remain the same as if we had measured both in meters or both in centimeters. This is because correlation only measures the strength and direction of the relationship between variables and not their actual values. However, it is important to note that although correlation is insensitive to scale, it can still be affected by outliers and the presence of non-linear relationships between variables.
Normalised Correlation Explained
Normalized Cross-Correlation (NCC) is a mathematical technique used to measure the similarity beween two images. It involves taking the Fourier transform of both images, multiplying them together, and then taking the inverse Fourier transform of the result. The normalization step involves dividing the product of the Fourier transforms by the local sums and sigmas of the images. This ensures that the correlation value is not affected by differences in brightness or contrast between the images. NCC is commonly used in computer vision and image processing applications, such as template matching and object recognition, to find the best match between two images. It is a powerful tool that can accurately measure the similarity between images, even when they have been subjected to different lighting conditions, rotations, and other transformations.

Understanding Normalized Cross-correlation
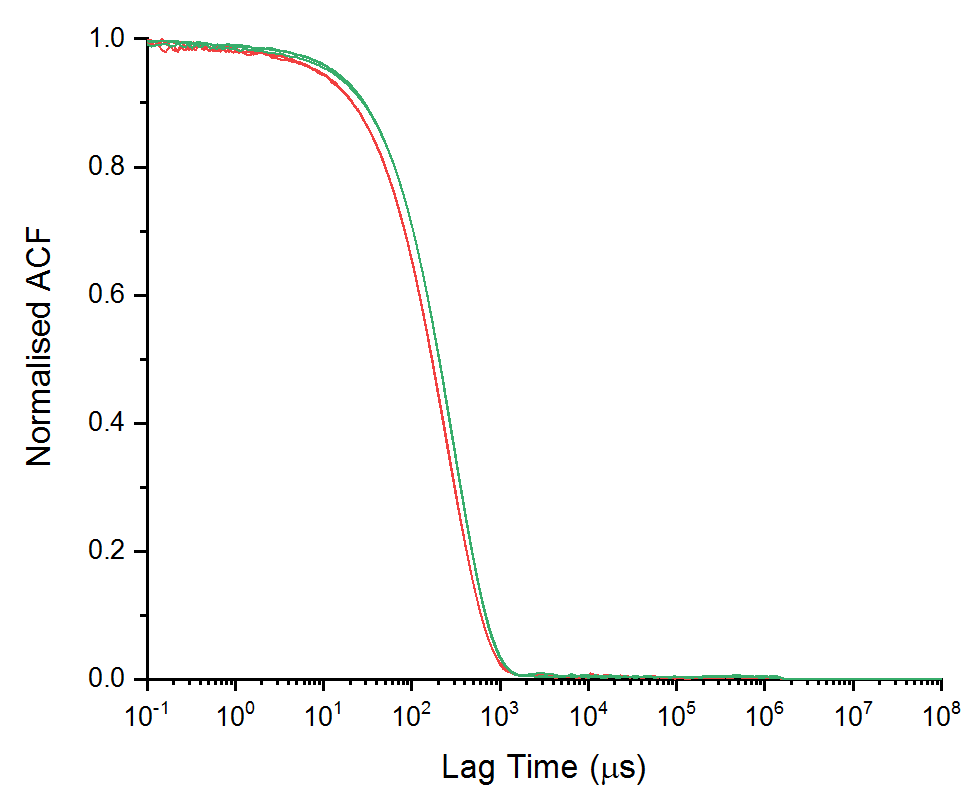
Normalized cross-correlation is a mathematical technique used to compare two time series, which can have different value ranges, in order to determine how similar they are. The technique involves first calculating the mean and standard deviation of each time series, which allows for normalization and results in both series haing a mean of zero and a standard deviation of one.
The next step is to shift one of the time series by a certain amount and then calculate the correlation coefficient between the shifted series and the other series. This process is repeated for different shift amounts, resulting in a new time series that represents the correlation at each shift.
The correlation values are normalized again by dividing each by the maximum correlation value, resulting in a score between -1 and 1 that represents the degree of similarity between the two time series. A score of 1 indicates perfect correlation, while a score of -1 indicates perfect negative correlation.
Normalized cross-correlation is commonly used in fields such as signal processing, image analysis, and time series analysis, to compare and analyze data from different sources or at different time points.
Normalizing a Relation
Normalizing a relationship refers to the process of restoring friendly and cooperative ties between two countries that have been in conflict or have had strained relations in the past. This can occur after a period of hostility, such as a war, or it can happen when two countries have differing political ideologies or economic interests. The normalization of relations is typically achieved through diplomatic efforts and negotiations, whch aim to establish mutual trust, respect, and cooperation between the two parties. This can involve the exchange of ambassadors, the lifting of economic sanctions, the establishment of trade agreements, and the promotion of cultural ties. normalizing relations between two countries is an important step towards maintaining peace, stability, and prosperity in the international community.
Robustness of Pearson Correlation to Normality
Pearson correlation is generally considered to be robust to violations of normality assumptions. In fact, severl studies have shown that it can still provide reliable results even when there are significant departures from normality. This means that the Pearson correlation coefficient can still be used to measure the strength and direction of the linear relationship between two variables, even if the data is not normally distributed. However, it should be noted that extreme violations of normality can still have an impact on the validity of the results, and other measures of association may be more appropriate in those cases. while normality is an important assumption to keep in mind when using the Pearson correlation coefficient, it is generally considered to be a robust measure of association that can still provide meaningful results in a variety of contexts.
Can Correlation be Applied to Nominal Data?
Correlation measures the degree of relationship between two variables, and it is commonly used to analyze real-valued data. However, nominal data, also known as categorical data, do not have a natural order or numerical value, which makes it difficult to calculate a correlation coefficient.
Nevertheless, there are some techniques that can be used to measure the association between nominal variables. One of them is the chi-square test, which determines if there is a significant association between two categorical variables. Another approach is to use contingency tables and calculate measures such as the phi coefficient, the Cramer’s V, or the contingency coefficient. These measures provide information about the strength and direction of the association between the variables, but they do not have the same interpretation as the Pearson correlation coefficient.
It is important to note that the interpretation of these measures depends on the context and the research question. For example, a significant association between two variables may not necessarily imply that there is a causal relationship between them. Therefore, it is essential to carefully consider the limitations and assumptions of these techniques when analyzing nominal data.

When Not to Normalise Data
Normalizing data is a common technique used in machine learning to ensure that all features in a dataset are on the same scale. However, it is not always necessary to normalize data. Here are some scenarios when normalization may not be needed:
1. When the features have the same scale: If all the features in a dataset have the same scale, then normalization is not required. For example, if all the features in a dataset are between 0 and 1, then normalization is not needed.
2. When the algorithm used is not sensitive to scale: Some machine learning algorithms, such as decision trees and random forests, are not sensitive to the scale of features. In such cases, normalization is not required.
3. When the data is already normalized: If the data has already been normalized, then there is no need to normalize it again. This is oten the case with datasets that are widely used in machine learning, such as the MNIST dataset.
4. When normalization does not improve performance: In some cases, normalization may not improve the performance of a machine learning algorithm. It is always a good idea to experiment with and without normalization to see if it makes a difference in performance.
Normalization is not always necessary, and it is important to understand the characteristics of the dataset and the machine learning algorithm being used to determine if normalization is required.
Conclusion
Normalization does not affect the correlation coefficient between two variables. This is because the formula used to calculate the correlation coefficient standardizes the variables, meaning any chanes in scale or units of measurement will not have an impact on its value. Standardizing, or any linear transformation of the variables, will not change the correlation as any prior rescaling effect that might affect the covariance will be nullified by the scale normalization, which gives the final correlation estimate. Therefore, to normalize any set of numbers to be between 0 and 1, subtract the minimum and divide by the range. No need to standardize. It is important to note that the correlation coefficient is independent of the change of origin and scale, making it a reliable measure of the relationship between two variables.
