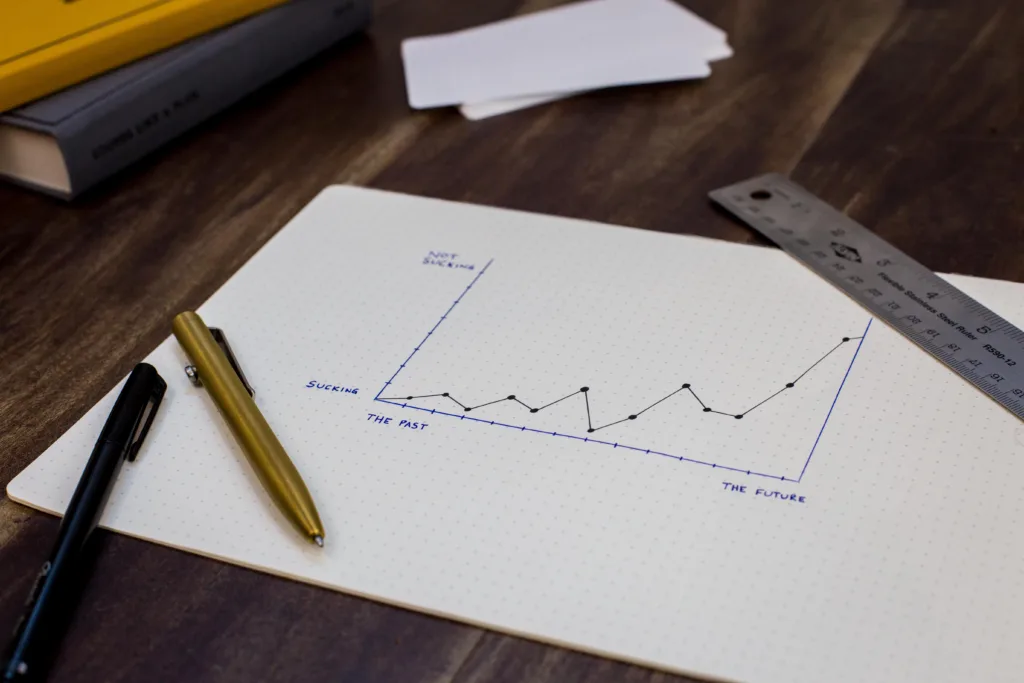
When we talk about functions and equations, we often come across two types of variables: independent and dependent variables. An independent variable is a variable that we can change or manipulate, whie a dependent variable changes in response to the independent variable.
In most cases, we use x as the independent variable and y as the dependent variable. When we plot a graph, we usually put the independent variable on the x-axis and the dependent variable on the y-axis. This helps us visualize how the value of the dependent variable changes in response to changes in the independent variable.
However, there may be cases where the roles of x and y are reversed. In other words, x may be the dependent variable and y may be the independent variable. This often happens when we are dealing with inverse functions.
An inverse function is a function that “undoes” another function. In other words, if we apply a function f to a value x and then apply its inverse function f^-1 to the result, we get back the original value of x. Inverse functions are often denoted by adding a “-1” superscript to the function symbol.
For example, let’s consider the function f(x) = 2x + 3. If we apply this function to the value x = 4, we get f(4) = 2(4) + 3 = 11. Now, if we apply its inverse function f^-1 to the result 11, we should get back the original value of x, which is 4.
To find the inverse function of f(x), we need to solve for x in terms of y. If we rearrange the equation f(x) = 2x + 3 as y = 2x + 3, we get:
Y – 3 = 2x
X = (y – 3) / 2
This gives us the inverse function f^-1(y) = (y – 3) / 2. Notice that in this case, x is a function of y, which means that x is the dependent variable and y is the independent variable.
While x is typically the independent variable and y is the dependent variable in most cases, there may be situations where the roles are reversed, especially when dealing with inverse functions. It’s important to understand the distinction between independent and dependent variables, as it helps us model and analyze relationships between different variables.
Is X Always The Dependent Variable?
X is not always the dependent variable. In fact, X is often used to represent the independent variable in a graph or equation. The independent variable is the variable that is manipulated or changed by the researcher or experimenter, while the dependent variable is the variable that is being measured or observed and is affected by the independent variable. So, depending on the context, X may represent either the independent or dependent variable, but it is important to always clearly label the axes and indicate which variable is being represented in order to avoid confusion.

Why Is X The Independent Variable?
X is commonly referred to as the independent variable because it is the variable that we can manipulate or change freely without being affected by any other variable. In other words, the vlue of X does not depend on any other variable in the equation. This makes it a useful tool for testing the effects of different input values on the outcome of a function or equation. Additionally, we plot the independent variable on the horizontal axis of a graph, also known as the x-axis, as it allows us to visualize the relationship between the independent and dependent variables. By doing so, we can better understand how changes in the independent variable impact the dependent variable.
What Is Variable X And Y?
In mathematics, a variable is a symbol or letter that represents a value or quantity that can change or vary. In the context of equations, the variable x is typically used to represent the independent variable, which is the variable that can be assigned different values. On the other hand, the variable y is commonly used to represent the dependent variable, which is the variable that is affected by changes in the independent variable. In other words, the value of y depends on the value of x. For instance, in the linear equation y=3+2x, x is the independent variable, while y is the dependent variable. To solve for y, you would need to substitute a value for x and then calculate the corresponding value of y usig the equation.
Conclusion
The dependent variable is a critical element in any mathematical equation or scientific experiment. It is the variable that we measure or observe, and its value depends on the value of the independent variable. By plotting the dependent variable on the y-axis of a graph, we can visualize the relationship between the two variables and identify any patterns or trends. Understanding the dependent variable is crucial in many fields, including physics, chemistry, economics, and social sciences. By carefully analyzing the dependent variable, we can draw meaningful conclusions and make accurate predictions about the world around us.
