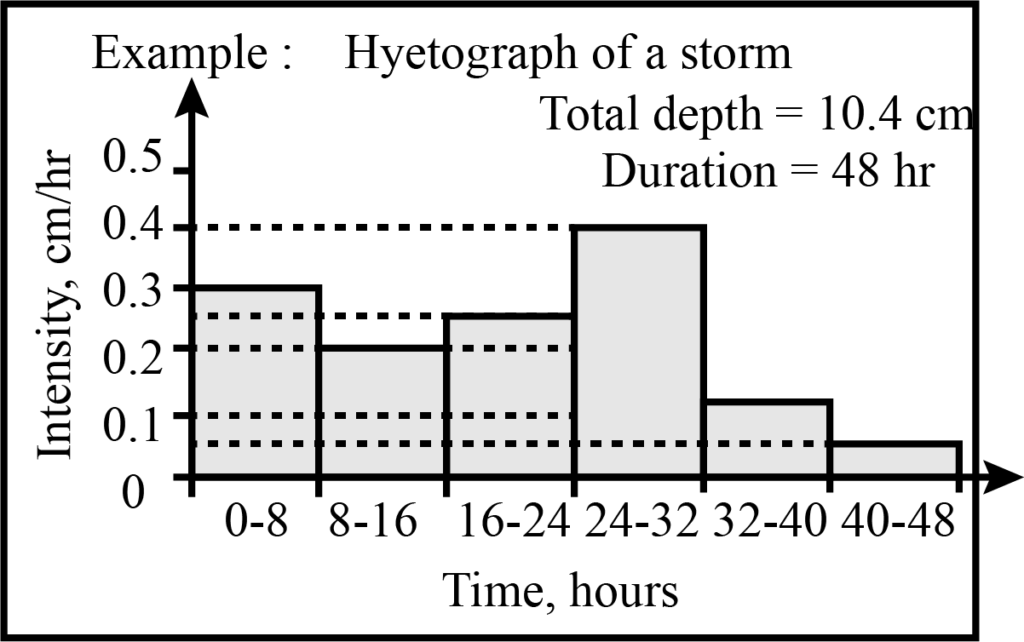
A hyetograph is a graphical representation of the distribution of rainfall intensity over time. It is an essential tool for hydrologists and engineers to understand how rainfall affects the flow of water in a catchment area. The hyetograph is a plot that shows the rainfall intensity on the y-axis and time on the x-axis.
Hyetographs are useful because they help us to understand the intensity of rainfall and how it changes over time. Rainfall intensity is a critical factor in the design of drainage systems and flood control measures. A hyetograph can help engineers to determine the maximum flow rate that a drainage system must be able to handle. This information is critical for preventing flooding in urban areas.
Hyetographs are also useful for understanding the impact of rainfall on water quality. When rainfall occurs, it can wash pollutants from the land into nearby waterways. A hyetograph can help us to understand how the intensity of rainfall affects the concentration of pollutants in the water.
To create a hyetograph, we need to multiply the rainfall excess by the catchment area, which converts rainfall to a volume. We then divide by the time step to calculate the volume per unit time. It is essential to ensure that flow is allocated to the correct time step. The rainfall during a time step produces the instantaneous flow at the end of the time step.
Hyetographs are often used in conjunction with other hydrological tools, such as flow-duration curves and mass curves. The mass curve depicts cumulative rainfall over time, but the hyetograph depicts rainfall intensity over time intervals. Flow-duration curves show the relationship between flow rate and the percentage of time that a paricular flow rate is exceeded.
Rainfall at a single location is referred to as point precipitation. However, rainfall intensity can vary significantly across a catchment area. Therefore, it is essential to collect data from multiple locations to create an accurate hyetograph.
Hyetographs are critical tools for understanding the impact of rainfall on water resources. They help us to understand the intensity of rainfall and how it changes over time. By using hyetographs, engineers and hydrologists can design drainage systems and flood control measures that can effectively manage rainfall and prevent flooding in urban areas.
The Use of a Hyetograph
A hyetograph is a tool used by meteorologists and hydrologists to graphically depict the distribution of rainfall intensity over time. This tool is beneficial in analyzing and predicting the effects of rainfall on the environment and infrastructure.
Hyetographs are used to determine the peak flow rates of rivers and streams during and after rainfall events. This is critical information for engineers and planners designing and maintaining infrastructure such as bridges, culverts, and stormwater management systems.
Additionally, hyetographs can be used to analyze the potential for flooding in specific areas. By examining the rainfall intensity over varius time periods, hydrologists can predict the likelihood of flooding and develop strategies to mitigate the damage caused by these events.
Hyetographs are also used in the field of agriculture to determine the optimal time for planting and harvesting crops. By analyzing rainfall patterns over time, farmers can make informed decisions about when to plant their crops and when to harvest them.
The hyetograph is a critical tool for analyzing and predicting the effects of rainfall on the environment and infrastructure. Its application extends to various fields, including engineering, hydrology, and agriculture.

Understanding Hydrographs and Hyetographs
Hydrograph and hyetograph are two important tools used in hydrology to study and analyze the behavior of water in a partiular region. While they may sound similar, they have distinct differences.
A hydrograph is a graph that plots the streamflow or discharge of a river or stream over a given period of time. The graph shows the relationship between the flow of water and time, typically in chronological order. Hydrographs are useful for analyzing the characteristics of a river or stream, such as its peak flow, base flow, and flood stage. They are also used in flood forecasting and management.
On the other hand, a hyetograph is a graph that plots the intensity of rainfall over a given period of time. The graph shows the relationship between the rainfall intensity and time, typically in hourly or daily intervals. Hyetographs are useful for studying the rainfall patterns in a particular region, and can help predict future floods or droughts.
Both hydrographs and hyetographs are important tools for water resource management and flood control. They can help hydrologists and engineers make informed decisions about water allocation, flood mitigation, and emergency response planning. Here are some key differences between the two:
– A hydrograph plots streamflow or discharge, while a hyetograph plots rainfall intensity.
– Hydrographs show the relationship between flow and time, while hyetographs show the relationship between rainfall and time.
– Hydrographs are used to analyze river or stream behavior, while hyetographs are used to study rainfall patterns.
– Hydrographs are useful for flood forecasting and management, while hyetographs can help predict future floods or droughts.
Hydrographs and hyetographs are important tools for hydrologists and engineers to understand the behavior of water in a particular region. By analyzing these graphs, they can make informed decisions about water resource management and flood control.
Calculating a Hyetograph
Calculating a hyetograph involves several steps that need to be followed carefully to obtain accurate results. Here is a step-by-step guide on how to calculate a hyetograph:
1. Determine the time intervals: The first step is to determine the time intervals for which the hyetograph will be calculated. Usually, the time interval is chosen based on the time step of the rainfall data available.
2. Calculate the rainfall excess: Once the time intervals are determined, the rainfall excess needs to be calculated for each interval. Rainfall excess is the amount of rainfall that exceeds the infiltration capacity of the soil and becomes runoff. This can be calculated by subtracting the infiltration capacity from the total rainfall for each time interval.
3. Multiply by the catchment area: After calculating the rainfall excess for each time interval, it needs to be multiplied by the catchment area. This will convert the rainfall excess to a volume.
4. Divide by the time step: The volume obtained in step 3 needs to be divided by the time step to get the volume per unit time. This will give the rate of runoff for each time interval.
5. Allocate flow to the correct time step: it is important to allocate the flow to the correct time step. This means that the rainfall during a time step produces the instantaneous flow at the end of the time step. This can be done by using a lag time or time of concentration approach.
By following these steps, you can calculate a hyetograph that accurately represents the runoff from a catchment during rainfall events.
Difference Between Hyetograph and Mass Curve
Rainfall is an essential component of the hydrological cycle, and its accurate measurement and analysis are crucial for water resources management. One of the fundamental concepts in rainfall analysis is the distinction between a hyetograph and a mass curve. While both of these terms are related to rainfall, they represent different aspects of this meteorological phenomenon.
A hyetograph is a graphical representation of rainfall intensity over a specific time interval, usually in hours or minutes. It is a plot of rainfall intensity against time, usually shown as a bar chart or a line graph. The hyetograph provides information on the temporal pattern of rainfall, including its duration, intensity, and frequency. This information is critical for the design of hydraulic structures, such as stormwater systems, culverts, and bridges.
On the other hand, a mass curve is a graphical representation of cumulative rainfall over time. It is a plot of the total amount of rainfall against time, usually shown as a line graph. The mass curve depicts the cumulative effect of rainfall over a given period, indicating the total volume of water that has fallen on a particular area. This information is used to estimate the water balance of a watershed, which is the difference between the total amount of water that enters and leaves the system.
The primary difference between a hyetograph and a mass curve is that the former shows the temporal pattern of rainfall intensity, while the later displays the cumulative effect of rainfall over time. While both of these graphical representations are essential for rainfall analysis, they provide different types of information that are used for different purposes.

Conclusion
The hyetograph is an essential tool for hydrologists and engineers to understand the distribution of rainfall intensity over time. It enables us to calculate the volume of water that flows into a catchment area during a given time period, which is crucial for flood prediction and management. Moreover, the hyetograph helps us identify the peak flow rates and the duration of the rainfall event, which are important for designing drainage systems and water resource management plans. By analyzing the hyetograph, we can also evaluate the effectiveness of dfferent flood control measures and improve our understanding of the hydrological cycle. Therefore, the hyetograph is an indispensable instrument for analyzing rainfall patterns and predicting their impact on the environment and infrastructure.
