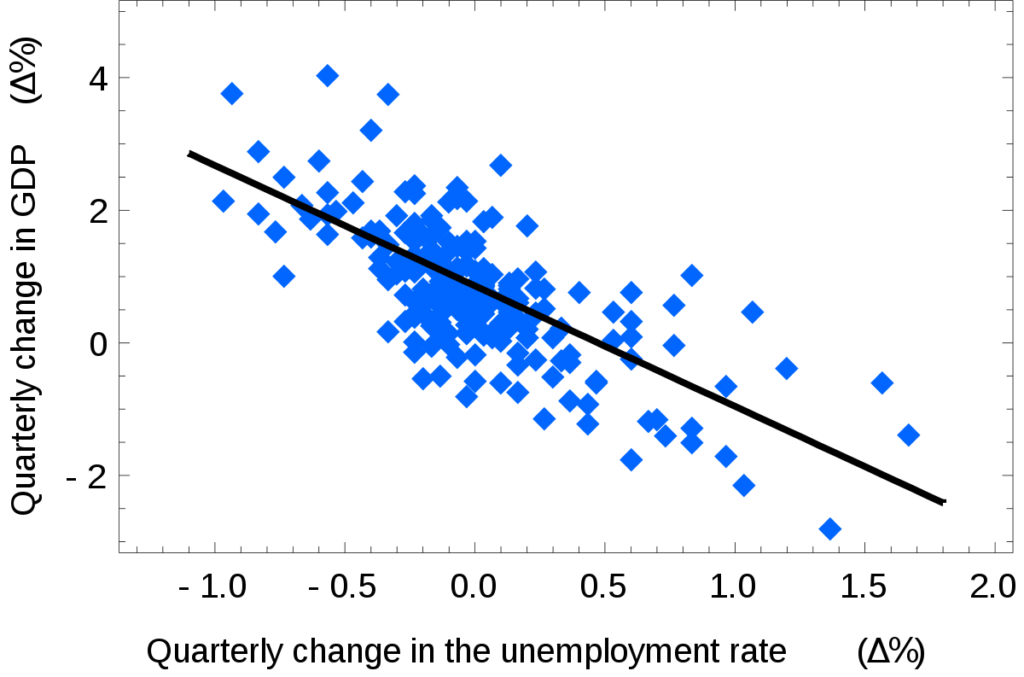
R Squared is a statistical measure of how well a regression model fits the data. It is commonly used to evaluate the accuracy of linear regression models, although it can be applied to non-linear models as well. The R Squared value is a number between 0 and 1, where 0 means that the model does not fit the data at all and 1 means that the model perfectly fits the data. However, under certain conditions, it is possible for R Squared values to be negative.
In linear regression models, R Squared measures how much of the variation in the dependent variable (the variable being predicted) can be explained by variation in the independent variables (the variables being used to make predictions). A higher R Squared value indicates that more of the variation in the dependent variable can be explained by variation in the independent variables. The closer R Squared is to 1, the better your model fits your data.
However, it’s possible for R Squared values to fall below zero. This usually happens when your model does not fit your data as well as simply taking an average of all of your data points would. A negative R Squared value indicates that your prediction tends to be less accurate than just taking an average over time. This isn’t necessarily bad – sometimes taking an average of all of your data points might actually provide more accurate predictions than a fancy regression model.
In short, expect R² values to be bounded between zero and one only if a linear regression model is fit and evaluated on the same dataset it was fitted on – otherwise, negative values are possible! While negative R² values are not alwys bad, they do indicate that your model may not be performing as well as you’d like it to – so make sure you’re paying attention to them!

Negative R Squared Values
A negative R-squared value indicates that the model used to predict a certain outcome is not an accurate representation of the data set. This can happen if the model chosen is overly simple, or if the data points used to fit the model do not accurately reflect the underlying trend in the data. In other words, it means that the model does not explain any of the variation in the data set, and instead performs worse than simply taking the average value of all observations in the data set over time.
Is R Squared Always Positive?
No, R² is not always positive. R² is a measure of how well a linear regression model fits the data it is evaluated on. If the model does not fit the data, then R² can take on negative values. Additionally, if the model is evaluated on different data than it was fitted on, then R² can also be negative. Therefore, R² is only bounded between zero and one if a linear regression model is fit and it is evaluated on the same data it was fitted on.
Can R Squared Values be Negative or Greater than 1?
No, R-squared values cannot be negative or greater than 1. R-squared is a statistic that measures the percentage of the variance in a dependent variable that is explained by an independent variable(s). It ranges from 0 to 1, and is commonly stated as a percentage ranging from 0% to 100%. A value of 0 indicates that the independent variable(s) do not explain any of the variance in the dependent variable; conversely, a value of 1 indicates that the independent variable(s) explain all of the variance in the dependent variable. Values greater than 1 or less than 0 are not possible.
The Strength of a Negative R Value Correlation
A negative R value indicates a strong correlation between two variables. The closer the R value is to -1, the stronger the correlation between the variables. This means that as one variable increases or decreases, so does the other variable in a predictable way. A negative R value of -1 indicates a perfect linear relationship between the two variables, which is the strongest possible correlation.
Identifying the Sign of R2
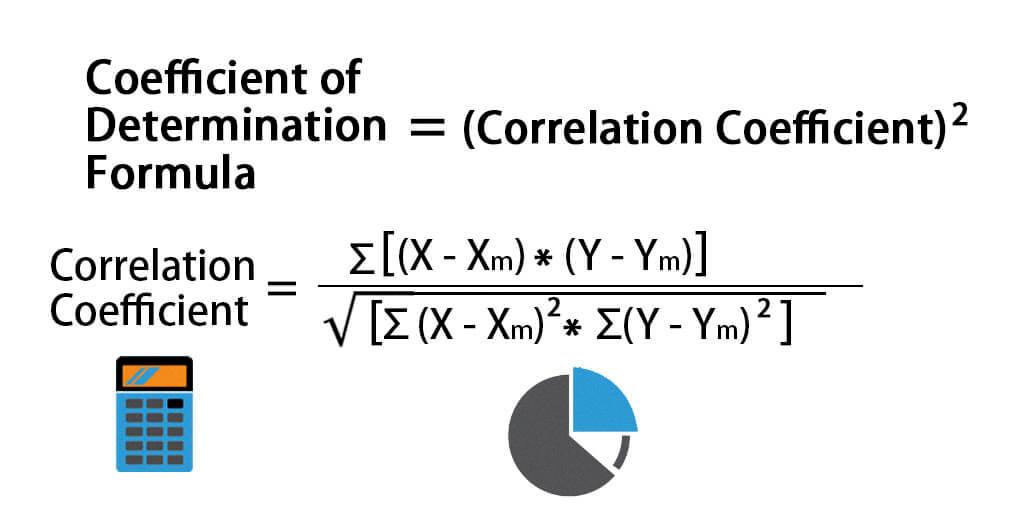
The coefficient of determination, or R2, is a measure of how well a set of data points fit a linear regression line. When the R2 value is greater than zero, it indicates that the model explains the variability in the data better than just using the mean of all observed values. This indicates that there is a positive linear relationship beween the two variables being considered. On the other hand, if the R2 value is less than zero, it indicates that there is a negative linear relationship between the two variables being considered, meaning that as one variable increases, the other decreases.

Source: educba.com
The Benefits of a Negative R Value
A negative r value indicates that there is an inverse relationship between two variables; as one increases, the other decreases. This can be a desirable outcome, depending on the context and what you are trying to measure. For example, if you are measuring the effect of smoking on lung cancer, a negative r value would be good becuse it would indicate that smokers are less likely to develop lung cancer. However, in other contexts a negative r value could indicate an undesirable outcome; for example, if you were measuring the effect of exercise on weight loss, a negative r value would suggest that exercising actually makes people gain weight. Ultimately, whether or not a negative r value is “good” will depend on the specific context and what you are trying to measure.
Interpreting the R-Squared Value in Regression
R-squared tells us how well our model explains the variation in the dependent variable. It is calculated by dividing the sum of squares of the regression model by the total sum of squares and is expressed as a percentage. R-squared values range from 0 to 1, with higher values indiating a better fit. A value of 1 means that our regression model explains all of the variance in the dependent variable, while a value of 0 means that it does not explain any variance. The closer our R-squared value is to 1, the better our model fits the data.
R-squared can be used to compare different models and determine which one best fits our data. It can also be used to evaluate how much improvement we get when adding new independent variables or when transforming existing ones. In addition, it can help us identify influential observations or outliers in our data set.
Conclusion
In conclusion, R-Squared is a metric used to evaluate the performance of a linear regression model. It is calculated by measuring the amount of variance in the data that is explained by the model and comparing it to the total variance in the data. R-Squared values range from zero to one and indicate how well the model fits the data. A value of one indicates a perfect fit while a value of zero indicates no fit at all. Negative values may occur when evaluating models on different data sets than they are fitted on. In general, higher R-Squared values indicate more accurate predictions, though caution should stil be taken when interpreting this metric as it does not always provide an accurate picture.
