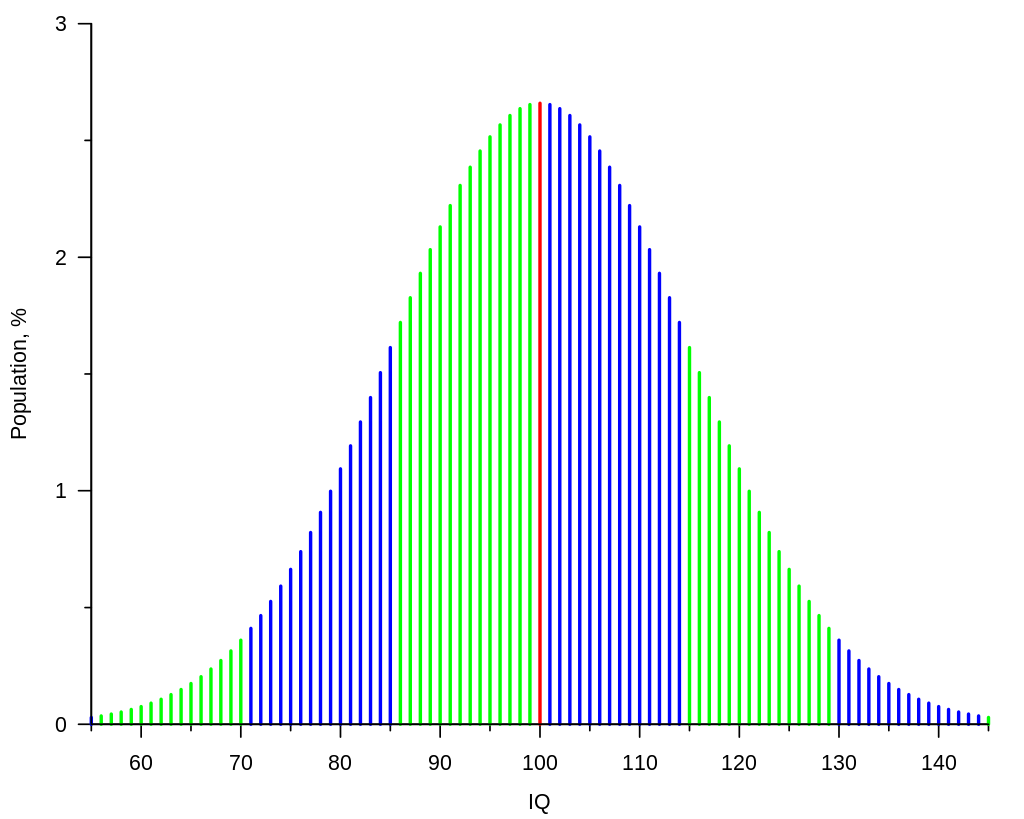
A bell shaped histogram is a graph that depicts the distribution of a set of values acoss a specified group. This type of graph is also known as a ‘normal curve’ or ‘bell curve’ due to its bell-like shape. It is often used to visualize the central tendency and spread of data points in a given dataset.
The top of the curve shows the mean, mode, and median of the data collected. Its relative width around the mean is determined by its standard deviation. A bell shaped histogram typically has no skew, meaning that it has a symmetrical shape with a peak in the centre and two tails either side which are mirror images of each other. The mean, median and mode are all in the same position on the graph (right thrugh the centre of the peak).
In order to interpret a bell shaped histogram it is important to understand what range of values your data falls into and whether or not it follows a normal distribution pattern. If your data does follow this pattern then you can use this graph to better understand it and draw useful conclusions from it. For example, you may be able to use this information to compare different sets of data or make predictions about future trends based on what you can observe from your graph.
Overall, understanding how to read and interpret bell shaped histograms can be an invaluable tool for any data analyst or scientist working with large datasets. By being able to accurately read thee graphs you will be able to gain valuable insights into your data which can be used for decision making processes such as forecasting future trends or evaluating performance metrics over time.
The Characteristics of a Bell Shaped Histogram
A bell shaped histogram is a graphical representation of data that displays the frequency of values withn a given range. The graph is so called because it has the shape of a bell, with the highest point (the peak) in the middle and data points gradually decreasing in frequency as one moves away from the center. This type of graph is used to show how data are distributed around a central value, and it can be used to determine whether or not the data follows a particular pattern or distribution, such as a normal distribution. Bell shaped histograms are very useful for comparing different sets of data and seeing if they have similar patterns.

Indicating a Bell Curve
A bell curve indicates a normal distribution of values within a set. This type of graph is used to represent data in wich most of the values are centered around a central point, with the values tapering off symmetrically on either side. It is assumed that the data follows a pattern in which there are fewer extreme values and more common values that are closer to the center. This type of graph is also known as a Gaussian or normal distribution and is commonly used to display population data such as test scores, IQs, income levels, and other variables.
Bell-Shaped Distributions
Bell shaped distributions, also known as normal distributions, are a type of probability distribution that have a symmetrical shape. This means that the data follows a pattern where the mean, median and mode are all equal. The graph of a bell shaped distribution is often referred to as a “bell curve” because of its shape resembling a bell when plotted on a graph. This type of distribution is most liely to occur when dealing with data that has been randomly sampled from an underlying population with an approximately normal distribution of values. Examples include physical characteristics such as height and weight, scores on tests and exams, and even stock market prices.
Can a Bell-Shaped Histogram Be Skewed?
No, a bell shaped histogram cannot be skewed. A bell shaped histogram is symmetrical and has no skew because the peak of the graph is in the centre and the tails either side of the peak are a mirror image of each other. As such, the mean, median and mode are all in the same position on the graph (right though the centre of the peak). Skewed distributions, on the other hand, have a peak that is either shifted to one side or is asymmetrical, which results in different values for mean, median and mode.
The Origin of the Bell-Shaped Curve
The normal distribution is often referred to as a bell curve because the graph of its probability density looks like a bell when plotted on a graph. The shape of the curve is characterized by its mean, or average, which is in the middle of the bell. On either side, the data points drop off symmetrically and approach zero as they move away from the mean. As you get further away from the mean, fewr and fewer data points are observed; this results in the bell-shaped curve that we see when plotting out a normal distribution.

Source: blogs.sas.com
Understanding Skewed Bell Curves
When a bell curve is skewed, it means that the data points are not distributed symmetrically on either side of the median. Instead, the points are clustered disproportionately to one side of the median, resulting in the curve being shifted either to the left or right. This indicates that there is an imbalance in the distribution of values around the median, which can be caused by outliers or other factors that affect the data set.
Analyzing a Bell Curve
Analyzing a bell curve involves looking at the distribution of scores and interpreting the data. The bell curve is typically used to represent a normal distribution, which is a type of probability distribution that has a symmetrical shape with most values clustered around the mean (average). To analyze a bell curve, look at the center point, or mode, which is where the largest portion of scores will fall. Then examine how the scores are spread out from there; usually, they decrease as you move away from the mean in both directions. This will give you an idea of how many high and low scores there are in relation to those near the center. You can also use measures such as standard deviation or quartiles to compare different distributions and get an even beter understanding of how the data is distributed.
The Use of the Bell Curve to Represent the Normal Distribution
The bell curve is used to represent the normal distribution because it is a graphical representation of the way that data is distributed in a population. It shows that most of the data points are clustered around the mean, and that there are fewer and fewer data points as you move away from the mean. This pattern is known as a symmetric distribution, which means that the values on either side of the mean are equally likely. The bell curve also illustrates how spread out the data is by showing how far away from the mean most of the data points lie. The area under the bell curve represents all possble values for a given variable, with a higher probability for values near to the mean than those farther away from it. By plotting this pattern, we can better understand how likely different values for a variable are in this population.
The Bell Curve: A Type of Function
A bell curve, also known as a normal distribution or Gaussian distribution, is a type of probability distribution characterized by a symmetric, bell-shaped curve. The graph of the bell curve shows that data values are concentrated around the mean, and become increasingly rare as they diverge from the mean. This type of function is typically used to represent data that has been measured in some way, such as height, weight, or IQ scores. On a bell curve graph, the mean (average) value is represented by the peak of the curve. To either side of this peak are two tails that represent increasingly rare occurrences of values further away from the mean. This type of function is ueful for understanding how data normally distributes itself and for making predictions about what results can be expected from experiments or surveys.

Source: scikit-image.org
Is the Bell Curve a Normal Distribution?
Yes, a normal distribution is generally bell shaped. This means that the graph of the distribution will look like a bell, with the majority of data points in the center and fewer points further away from the center. The shape is symmetrical around the mean, so that half of the data points are on either side of it. The mean and median are also equal in a normal distribution, and 68% of all data falls within 1 standard deviation from the mean.
Identifying Skewness in a Histogram
To determine whether a histogram is skewed or symmetric, you will need to examine the shape of the data. A symmetric distribution will have a “bell-shape” that is centered around its mean, meaning that the two halves of the histogram are mirror images of one another. Additionally, the mean, median, and mode of a symmetric distribution will be equal. A skewed (non-symmetric) distribution, on the oter hand, will not have this bell shape and its two halves will not appear as mirror images of one another. Additionally, the mean, median and mode may not be equal in a skewed distribution.
Identifying the Distribution of a Histogram
To determine if a histogram is normally distributed or skewed, you will need to look at the shape of the graph. A normal distribution has a symmetrical bell-shaped curve, while a skewed distribution is not symmetrical and may have either a longer left tail or a longer right tail. To further assess the data, you can calculate the mean, median, and mode of the data set and compare these values. If these three values are close in value, it is likely that the data folows a normal distribution. Additionally, if there are no outliers in your data set, this also suggests that your data follows a normal distribution.
Conclusion
In conclusion, a bell-shaped histogram is an effective way of displaying data. It provides a graphical illustration of the normal distribution of the data, with the mean, median and mode all located at the peak in the centre. The tails on eiher side of the peak are symmetrical, showing that there is no skew in the data. This type of graph provides an intuitive approach to visualizing and understanding distributions of data.
